What is the Mandelbrot Set Anyway ?
Tuesday, 30th of January, 2018
Completely rewritten, Thursday, 8th of April, 2021
All of the images in this post were created by me with PHP, the GD image library, GIMP and InkScape.
To try to explain what the Mandelbrot Set is I will break down the explanation into steps:
- What does the Mandelbrot Set look like?
- Where is the Mandelbrot Set?
- How is the Mandelbrot Set made?
- What is the Mandelbrot Set function?
- What is i ?
- Final conclusion - what is the Mandelbrot Set?
What does the Mandelbrot Set look like?
Some of you might have heard of the Mandlebrot Set but have no idea what it is. Well, this is how it looks-

Others may have seen it and had no idea what it is or what it is called. In fact, it is more than likely that everybody has seen it, or parts of it, dozens of times and not known what they were looking at. A small number of people might recognise it as one of those fractal thingies.
I am sure mathematicians would not be happy with that definition and would be more likely to give an entirely obtuse and unhelpful description like the following one given on Wikipedia-
The Mandelbrot set is the set of complex numbers c for which the function fc(z) = z² does not diverge when iterated from z = 0, i.e., for which the sequence fc(0), fc(fc(0)), etc., remains bounded in absolute value.
Wikipedia for Schools gives a more complete description but unfortunately it is no more helpful-
The Mandelbrot set is a set of points in the Complex Plane, the boundary of which forms a fractal. Mathematically, the Mandelbrot set can be defined as the set of complex c-values for which the orbit of 0 under iteration of the complex quadratic polynomial xn+1 = xn² + c remains bounded.
Eg. c = 1 gives the sequence 0, 1, 2, 5, 26… which leads to infinity. As this sequence is unbounded, 1 is not an element of the Mandelbrot set.
On the other hand, c = i gives the sequence 0, i, (-1 + i), –i, (-1 + i), -i… which is bounded, and so it belongs to the Mandelbrot set.
Basically a fractal, such as the Mandelbrot Set, is a mathematical construct which has infinite detail and displays characteristics of “self-similarity”, meaning that small sections of it, at any scale, resemble other sections of it at any other scale.
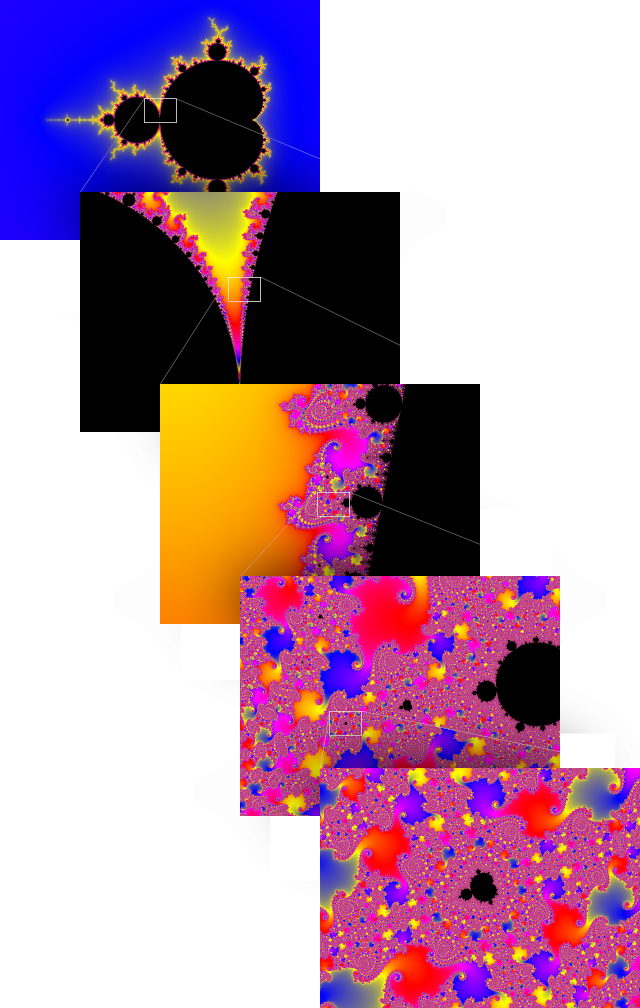
You can zoom into the Mandelbrot Set forever and it will reveal a never-ending complexity of detail-
Where is the Mandelbrot Set ?
It exists on the Complex Plane within a within a circle with radius of 2 and whose centre is the centre of the plane.
")
The Complex Plane is a variation of the Cartesian Plane.
On the Cartesian Plane every point can be defined by where it is in relation to the X-axis and the Y-axis and this is given in the form of an (X,Y) “co-ordinate”, or, how far it is left or right and how far it is up or down, like in the following image-

For example, the red dot is 3 across and 2 up so it is expressed as (3,2). The green dot is on the negative side of the Y-axis as well as the negative side of the X-axis so it is -2 horizontally and -4 vertically and is expressed as (-2,-4). The blue dot is expressed as (-4,3).
The difference between the Cartesian Plane and the Complex Plane is the Y-axis is replaced by the iY-axis.

So, in the image above, the red dot is at (5,3i) and the blue dot is at (-4,-3i).
Basically it is exactly the same except that all of the Y values are multiplied by the number i.
How is the Mandelbrot Set made ?
First we need to define a grid of squares very close to the centre of the Complex Plane where we will draw our Mandelbrot Set. As the Mandelbrot Set is slightly off centre our grid of squares also needs to be off centre-
![]()
We will run through all of the squares one-by-one and we will use that square’s co-ordinate in the Mandelbrot Set function in order to calculate what colour we should end up with.
We also need to define a palette of colours to which we can refer after we have run each square's co-ordinate through the function - this palette can be anything you like and can contain as many, or as few colours as you like, as shown in this example-

After we have run all of the squares in our grid through the function we should have assigned a colour to each of them - either from the palette we chose, or black-

If we want a smoother, more detailed picture all we need is to define a grid with smaller aquares, like the one below which also shows the palette number chosen-

What is the Mandelbrot Set function ?
Think of a “function” as being like a machine - you load raw materials into one end and something new comes out the other end.
For a sausage making machine you load the raw ingredients into one end (fat, gristle, sawdust from the floor, a tiny amount of actual meat) and sausages come out the other end.
In the case of the Mandelbrot Set function you put an (x,iy) “co-ordinate” into the function and a new (x,iy) “co-ordinate” comes out of it.

If we were to take, for example, the co-ordinate-
(-1.4433333336666667, -0.47916666666666663i)
-and enter it into the Mandelbrot Set function we would get back a new co-ordinate-
(0.4102770839622225, 0.9040277780972222i)
-as shown in the following image-

We would then take that new co-ordinate and enter it back into the Mandelbrot Set function and we would get back another new co-ordinate-
(-2.0922722716135227, 0.26263709457048434i)
-as shown in the following image-

And again, we would take the last new co-ordinate and put it back into the function and we would get back another new co-ordinate-
(2.865291681451718, -1.5781832876005923i)

Each time we use the function we measure the distance of the new co-ordinate to the centre of the Complex Plane and if the distance is greater than 2 (it is outside the red circle) we stop putting the co-ordinates back into the function.
Instead we count how many times we repeated the process and we use that to colour the square at the start co-ordinate. In the case above we used the function 3 times before it gave back a co-ordinate which was further from the centre of the Complex Plane than 2, so we use the 3rd colour we selected for our palette to colour the square-
However, you cannot always be guaranteed that the function will return a co-ordinate which is further than 2 from the centre of the Complex Plane.
Depending upon the starting co-ordinate which is put into the function there are 3 different end results which can occur.
The first end result is the new co-ordinates spiral outwards away from centre of the Complex Plane and end up with a distance from the centre of the plane which is greater than 2 (they land outside the red circle)-

As above, we count how many times this process happens and use that to give the start co-ordinate a colour.
The second end result is the new co-ordinates spiral around for infinity, getting closer and closer to a final co-ordinate:

Because this is a process which could literally run forever, it needs to be terminated so we can move on to another square to work out what its colour should be, so what we do is we allow it to run a maximum number of times and if the new co-ordinates never pass beyond a distance of 2 from the centre of the Complex Plane, we simply colour the square black and move on.
The third end result is similar the the one above, but instead of spiralling around a single final co-ordinate it oscilates between two or more final co-ordinates, one of which is, or is near to, the starting co-ordinate:

Like the previous end result, this could run forever, so we allow it to run a maximum number of times and then colour the square black.
For us the interesting end result is the first one as this is the one which yields beautiful, complex pictures.
Below is an interactive plot of Mandelbrot Set function which shows you exactly what happens at each point - the lines start out yellow in colour and become progressively redder as more calculations are made - just move your mouse pointer over the image to see what happens:
This, and similar fractal functions, only work because of the number i and the weird way it behaves.
What is i ?
Ok, this is when it starts to get a bit weird but if you hang in there I'll try to make this as easy as possible.
When you multiply any number by itself the result is always positive.
For example: when you multiply 3 by 3 the result is 9:
3 × 3 = 9
The result is the same when any negative number is multiplied by itself, so if you multiply minus 3 by minus 3 the result will also be 9:
-3 × -3 = 9
You can never multiply any number by itself and come up with a negative result.
The “square root” of a number is the number which must be multiplied by itself to arrive at that number.
To make this clearer take a look at the diagram below. You can see that there are 9 green squares in total and there are 3 squares along each side. You should be able to see from it that the 3 rows and the 3 columns, when multiplied, result in 9 squares. Conversely you should aslo be able to see that in order to get 9 squares you must multiply 3 by 3. Therefore 3 is the square root of 9.

Similarly, for the blue squares 5 is the square root of 25 and for the yellow squares 10 is the square root of 100.
When this is written down, for the green squares, this is how it looks-
= ±3
If you look closely you can see there is a combined plus and minus symbol in front of the number 3 because it could be +3 or it could be -3.
Hopefully this all makes sense so far.
Now imagine you wanted to get the square root of -9.
Simply put - you can't.
Remember - when you multiply two identical numbers together the result is always a positive number.
This is where i comes in. It is the magic number that, when multiplied by itself, results in -1.
i × i = -1
Therefore i is the square root of -1.
= i
While i may be irrational (or impossible) it is also very useful for achieving something which can not be achieved otherwise. For example, if you multiply 3 by i, the result of which will be 3i, and then multiply 3i by itself, this is what will happen-
3i × 3i = -9
It is this special property of i which makes fractals, like the Mandelbrot Set, possible and makes the functions, like the Mandelbrot Set function, work the way they do.
Final conclusion - what is the Mandelbrot Set ?
The final conclusion is not what you might have thought it would be - what exactly is the Mandelbrot Set?
It is the black part-